BasideWT- Whole Home Water Filtration System & Replacement


UF Membrane Flow Rate: How to Calculate and Optimize Performance
UF membrane flow rate is the volume of water a membrane produces over time. It’s usually measured in liters per hour or gallons per minute. This flow rate depends on membrane area, applied pressure, water temperature, and feed water quality.
A membrane rated for a certain flow under lab conditions rarely delivers that exact number in the field. In practice, real installations rarely match test conditions.
Understanding this number matters more than most buyers realize. Undersize a UF system and you starve a downstream process. Oversize it and you pay for capacity you never use. So getting the calculation right makes the difference between a system that performs as expected and one that disappoints an owner six months later.
This article stays focused on UF membrane flow rate. It covers what it means, how to calculate it, what changes it, and how to keep it stable. For background on how ultrafiltration works, see this step-by-step explanation of UF membrane operation.
Flow Rate vs Membrane Flux: Why the Distinction Matters
Flow rate and flux describe related but different things. Specifically, flow rate is a raw volume, like liters per minute. Flux, on the other hand, is that volume divided by membrane area. Engineers usually express flux as LMH, or liters per square meter per hour.
Two membranes can share the same flow rate but have very different flux values. For instance, a large module with more surface area can produce the same output while working each square meter less hard. That difference matters for long-term fouling and cleaning frequency.
Because of this, engineers use flux to compare membranes fairly, independent of module size. Homeowners and plant operators, meanwhile, care more about flow rate. After all, it tells them how much treated water they actually get.
Common Units Used for UF Flow and Flux
Different suppliers and regions use different unit systems. As a result, confusing them is one of the most common mistakes buyers make when comparing membrane specifications.
| Measurement | Common Units | Typical Use |
|---|---|---|
| Flow rate | L/min, m³/h, GPM, GPD | Total system output |
| Flux | LMH (L/m²/h), GFD (gal/ft²/day) | Membrane-area-normalized rate |
| Membrane area | m², ft² | Sizing calculations |
| Pressure | bar, psi, kPa | Driving force behind flow |
Always confirm which unit a manufacturer quotes before comparing two products. Otherwise, you can’t compare a flux value in LMH directly to a flow rate in GPM. You need to convert first.
How UF Membrane Flow Rate Is Measured
A flow meter on the permeate line measures flow rate directly. Here, the permeate line is the pipe that carries treated water away from the membrane. Most systems also track feed flow and concentrate (or reject) flow to calculate recovery.
Manufacturers test flow rate under controlled lab conditions. Specifically, they use clean water, fixed temperature, fixed pressure, and a new membrane. This testing gives a repeatable baseline number. But it’s not the number you should expect during daily operation.
Field flow rate uses the same measurement method, a flow meter. However, it reflects real feed water, real temperature swings, and a membrane that fouls gradually over time.
How to Calculate UF Membrane Flow Rate
The core relationship is simple. Flux multiplied by membrane area gives flow rate.
Formula:
Q = J × A
Where:
- Q = permeate flow rate (L/h)
- J = flux (LMH, or L/m²/h)
- A = membrane area (m²)
Example Calculation
Say a hollow-fiber module has 20 m² of membrane area. Under its rated operating conditions, it achieves a flux of 60 LMH.
Q = 60 LMH × 20 m² = 1,200 L/h
So this module should theoretically produce about 1,200 liters of permeate per hour. That number assumes clean feed water, correct pressure, and a stabilized membrane. It doesn’t account for day-one, worst-case, or fouled conditions.
Working Backward From a Target Flow
Sometimes the question runs the other direction. How much membrane area do you need to hit a target flow rate?
A = Q ÷ J
For example, say a project needs 3,000 L/h and the chosen membrane runs at a flux of 50 LMH. The required area then works out to 60 m². Keep in mind, though, that this calculation only holds if the assumed flux is realistic for the actual feed water. It shouldn’t rely on the manufacturer’s clean-water test value alone.
What Affects UF Membrane Flow Rate
Flow rate isn’t a fixed property of a membrane. Instead, it shifts constantly based on operating conditions. The operating pressure, flow, and temperature guide covers these interactions in more depth, and the main drivers appear below.
Membrane Area
More surface area means more flow at the same flux, assuming the same pressure and water quality. This is why industrial systems use multiple large modules instead of one small one.
Pressure and Transmembrane Pressure (TMP)
Water moves through the membrane because of a pressure difference between the feed side and the permeate side. This difference is called transmembrane pressure. Generally, higher TMP increases flow, up to a point. Beyond that point, fouling limits the membrane surface more than pressure does.
Temperature and Viscosity
Cold water is more viscous, so it’s harder to push through the membrane. As a result, flow rate typically drops in winter and rises in summer, even with identical pressure and membrane condition.
Feed Water Quality
Turbidity and suspended solids build up on the membrane surface and inside the pores. Consequently, dirtier feed water reduces flow rate faster than clean feed water, even at the same starting flux.
Membrane Configuration
Hollow-fiber modules pack a large surface area into a compact housing. This design affects both baseline flow capacity and how the module responds to fouling. For more detail, the hollow-fiber UF membrane guide explains how fiber geometry shapes these characteristics.
Clean-Water Flow vs Actual Operating Flow
Manufacturers publish a clean-water flow rate. This number comes from testing with purified water under ideal, controlled conditions.
In practice, actual operating flow is almost always lower. Real feed water carries particles, organics, and minerals that clean test water doesn’t. So expect the field number to sit below the datasheet number, sometimes significantly.
Therefore, treat the clean-water figure as a ceiling, not a promise. It shows what the membrane can do, not what it will deliver on your specific water source.
Initial Flow vs Stabilized Flow
A brand-new membrane often produces a higher flow rate in its first hours or days of operation. Over time, this initial flow settles into a lower, more stable number as the membrane surface adjusts to the feed water.
For this reason, system designers should size around stabilized flow, not the initial spike. Sizing to the first-day number leads to underperformance once the membrane settles in.
Flow Decline, Fouling, and Backwashing
Flow rate naturally declines between cleaning cycles. Particles, organics, and scale build up on the membrane surface and inside pores, and this buildup adds resistance that pressure alone can’t fully overcome.
Still, this decline is normal and not necessarily a defect. The UF membrane fouling guide explains the underlying causes in detail.
Backwashing reverses part of this decline by pushing water back through the membrane to dislodge trapped material. A well-timed backwash schedule restores much of the lost flow. Even so, it rarely brings the membrane back to its original clean-water number. For more on this, the UF membrane cleaning and backwashing guide walks through how backwash frequency affects long-term flow stability.
| Condition | Typical Flow Behavior |
|---|---|
| New, clean membrane | Highest flow, may exceed rated value briefly |
| Stabilized, clean feed | Flow settles near rated operating value |
| Fouled, pre-backwash | Flow declines gradually over the cycle |
| Post-backwash | Flow recovers, usually not to 100% of original |
| Chemically cleaned | Flow recovers close to original, depending on fouling severity |
Recovery, Permeate Flow, and Concentrate Flow
Recovery describes what percentage of the feed water becomes usable permeate. The rest leaves the system as concentrate or reject flow, a stream that carries away the particles and solids the membrane captured.
Formula:
Recovery (%) = (Permeate Flow ÷ Feed Flow) × 100
For example, take a system fed at 100 L/min that produces 90 L/min of permeate and 10 L/min of concentrate. That system runs at 90% recovery. But pushing recovery too high concentrates contaminants near the membrane surface. This, in turn, accelerates fouling and can reduce flow rate faster than a moderate recovery target would.
Practical Flow Rate Examples
These examples are illustrative only. They aren’t manufacturer guarantees, so don’t treat them as universal performance numbers.
Residential Example
A homeowner installs a UF unit with 2 m² of membrane area rated at 40 LMH under test conditions. Theoretical flow works out to 80 L/h. In practice, though, sustained flow often runs lower. With moderate feed water turbidity and normal household pressure, expect closer to 55–65 L/h once the membrane stabilizes.
Small Commercial Example
A small commercial system uses a 15 m² module at a target flux of 45 LMH, which gives a theoretical flow of 675 L/h. Typically, operators add a margin here, sizing for 20–30% more area than the bare calculation suggests, to account for fouling between cleaning cycles.
Industrial Example
A larger installation might use multiple parallel modules totaling 300 m² of membrane area. At an average operating flux of 50 LMH, total system flow reaches roughly 15,000 L/h. Typically, industrial designs split this across several skids, so one unit can go offline for cleaning without stopping production.
Why Two Similar Membranes Can Produce Different Real-World Flow
Two membranes with identical published specifications can still behave differently once installed. Manufacturing tolerances, pore structure consistency, and even small differences in module potting can shift real-world flux slightly.
Feed water also plays a larger role than most buyers expect. For example, a membrane performing well on one water source may show noticeably lower flow on another. Higher organic content or a different particle size distribution can cause this, even at the same rated flux.
Common Calculation Mistakes
Several mistakes show up repeatedly in flow rate sizing:
- Mixing up flux and flow rate when comparing two membrane options.
- Using clean-water flow as the design number, without a margin for fouling.
- Ignoring temperature, especially for installations in cold climates.
- Skipping recovery calculations, which leads to underestimating feed water demand.
- Assuming flow scales linearly with pressure indefinitely, when most membranes hit a flux ceiling well before that.
Common Flow-Rate Selection Mistakes
Selection mistakes differ from calculation mistakes, since these happen even when the math is correct.
- Choosing a membrane sized for average feed water, without accounting for seasonal turbidity spikes.
- Selecting a single large module instead of multiple smaller ones, which removes the ability to clean one unit without stopping the whole system.
- Ignoring pretreatment needs, which forces the UF membrane to handle a fouling load it was never meant to carry.
For a broader look at selection criteria, the guide to choosing the right UF membrane covers criteria beyond flow rate alone, including pore size and material choice.
How to Optimize UF Membrane Flow Rate
A few practices keep flow rate closer to its design target over the long term:
- Match pretreatment to feed water quality. Removing large particles before they reach the membrane reduces fouling load significantly.
- Follow a consistent backwash schedule. Waiting too long between backwashes lets fouling compound instead of clearing it early.
- Avoid running at maximum recovery continuously. A slightly lower recovery target often extends stable flow periods.
- Monitor TMP alongside flow. Rising TMP at a constant flow rate is an early sign of fouling before flow actually drops.
- Size with a fouling margin, not just the clean-water number, so normal decline doesn’t push output below requirements.
How Excess or Insufficient Flow Affects the System
Pushing a membrane beyond its intended flux to chase higher flow accelerates fouling and can shorten membrane life. Simply put, the membrane surface can’t pass water faster than its pore structure and TMP allow. Trying anyway just means paying a fouling penalty later.
On the other hand, running well below intended flow wastes installed capacity. It can also point to a pressure or fouling problem worth investigating, rather than a limitation to just accept.
Interpreting Manufacturer Flow Specifications
A published flow rate reflects test conditions, not a guarantee for every installation. So treat it as a starting point for sizing calculations, then apply real feed water characteristics, expected temperature range, and a fouling margin before finalizing a design.
This is also why the same membrane model can carry different “typical” flow figures across different suppliers’ literature. Test protocols, water sources, and margins built into the published number all vary. On this point, a field study on UF operating parameters and flux performance offers a useful look, measuring how pressure, cross-flow velocity, and temperature affect real ultrafiltration output on production-scale wastewater in China.
Overall, manufacturer numbers work best as one input among several. They shouldn’t be the final word on what a system delivers once installed and running.
Bringing It Together
UF membrane flow rate comes down to a straightforward relationship between flux and membrane area. Pressure, temperature, and feed water quality shape it continuously. So the clean-water number on a datasheet is a ceiling, not a promise. Instead, stabilized field flow is what any sizing decision should be built around.
In short, calculating flow rate correctly means separating flux from flow, applying a realistic fouling margin, and checking recovery alongside output. And keeping that flow rate stable over time comes down to pretreatment, consistent backwashing, and resisting the urge to push recovery or flux past what the membrane and feed water can sustain.
RELATED POSTS

Clear vs Blue Water Filter Housing: Which One Should You Choose?
Deionized Water: The Complete Guide to Uses, Benefits, and Systems
How Does a UV Water Sterilizer Work? Step-by-Step Guide
What is an FRP Water Tank?
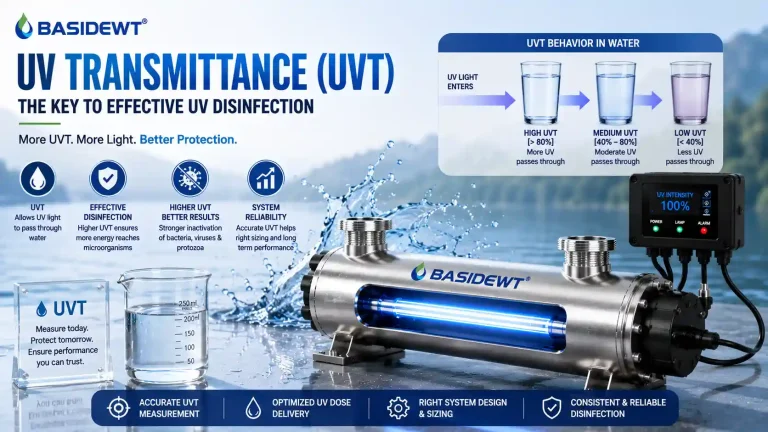
UV Transmittance (UVT) in Water Treatment Explained